CLI reference¶
crowdsim <subcommand> [flags]. Everything the tool does is a subcommand of one bash script,
bin/crowdsim, whose comment header is also its --help.
crowdsim next                                             # where you are, and the one command to run next
crowdsim doctor                                          # what is missing on this machine
crowdsim discover --profile p.json --limit 400            # build a URL pool from the sitemap
crowdsim probe    --profile p.json --target edge          # reachability + cache headers hop by hop
crowdsim load     --profile p.json --target edge --peak 60
crowdsim cache-ab --profile p.json --ttl 10               # two proxy legs, one origin
crowdsim validate p.json                                  # every rule at once, before anything runs
crowdsim history --last 10                                # one line per run: does the knee move?
crowdsim compare <run-a> <run-b>                          # the delta, or a refusal if they differ
crowdsim record  session.har                              # a browser HAR export → a journey file
crowdsim weights access.log --profile p.json              # the class mix, counted on your own log
crowdsim init                                             # a first profile, drafted from what was measured
crowdsim report  <run-id>                                 # one run as markdown you can paste in a ticket
crowdsim report  <run-id> --html                          # the same run drawn: the ramp, the knee, per class
crowdsim serve                                            # the GUI, on loopback
Asking about one subcommand¶
crowdsim --help is the synopsis of everything. crowdsim <subcommand> --help is that subcommand's own
synopsis, its own flags and one copy-pasteable example — and it exits 0, because asking for help is
not a usage error:
crowdsim load --help        # twenty flags, without reading the other twelve subcommands first
crowdsim report --help
crowdsim cache-ab --help
Both come from the same comment header in bin/crowdsim, extracted by structure: the global help stops
at a marker line, and each subcommand's text is the block below it. Two sources would disagree once, and a
help page that contradicts the tool is worse than a long one. tests/cli/help.bats asserts that every flag
the argument parser accepts appears in at least one block, so a flag added and never documented fails the
suite rather than shipping invisible.
That is also why the shell completions can read the header instead of carrying their own copy of the flag list.
latest and previous¶
Anywhere a run id is accepted — report, compare, report --compare — latest and previous resolve
to one, through a single resolver:
crowdsim report latest
crowdsim compare previous latest
crowdsim report latest --compare previous --html
The resolution is always printed, on stderr so it never lands in a redirected report:
A convenience that silently picks a run is how a result gets attributed to the wrong experiment — and
20260901T123654Z and 20260901T123645Z are one glance apart, which is the other half of why retyping
them by hand was the problem.
latest skips nothing. The newest run resolves even when it is a discard (generator_ok: false), and
is then reported as the discard it is. Quietly stepping back to the previous run would hand over a
valid-looking result for a run nobody asked about.
With no runs at all, or previous when there is only one, it exits 2 and names crowdsim history.
Every refusal compare already has still applies to a resolved id: matching pool, matching profile, and a
generator that held the rate.
--version (and -V) answers the question that gets asked while something is going wrong. Inside the image
the answer is baked in at build time, because there is no package.json there to read: without it the CLI
had no answer and the GUI reported null, so the only source was whatever somebody typed into docker run
minutes earlier. docker inspect answers it too, from the OCI version label.
Subcommands¶
doctor¶
Checks prerequisites and prints what is missing. With --profile, also resolves the profile (pools inlined,
referenced files checked) and runs the full validation — the cheapest way to find out a profile is
broken. Always exits 0, even when it found errors: it is a report, not a gate, and a report that exits
non-zero gets wrapped in || true by the first person who scripts it. Use validate when you want a gate.
doctor --bench — measure the generator instead of declaring it¶
load warns you before a run the generator cannot sustain by comparing the bandwidth a peak implies against
safety.generator_mbps — a number typed into a profile by hand, usually once, usually copied to the next
profile. So the check that exists to stop you burning a window on an unmeasurable run rested on a guess.
--bench measures it: a throwaway HTTP server on loopback, k6 against it in a closed model, and the result
in out/bench-<run>.json, which the estimate reads when the profile declares nothing.
▶ measuring what this machine can generate (loopback, 10s, 40 VUs)
  nothing is sent to any target: the server below is started here and thrown away.
  ✅ this generator: 45068 req/s of 45 KB → 2080.0 MB/s (16640 Mbit/s)
     ⚠️  loopback: this is the CEILING of this machine, not a prediction. Every real path is
         narrower — a declared safety.generator_mbps you trust still wins over this number.
Run it on the host that will generate the load. Inside a container on a macOS or Windows host it measures
loopback inside the VM — 16 Gbit/s on the machine this was written on — which describes the VM's own
network and says nothing about the path to a target, the very layer that throttles such a run. The artefact
records where it was taken (in_container, kernel, virtualised), the run warns while measuring, and the
bandwidth estimate refuses to use a virtualised measurement as a ceiling: silence bought with that number
would be silence in the one place the warning matters.
Read the caveat as part of the number. Loopback is the best network this generator will ever see; the path
to a real target is narrower, always. What the measurement is genuinely good for is the req/s ceiling —
the limit that produces dropped iterations and generator_ok: false — and for telling a laptop apart from a
runner without anybody guessing.
Three properties, deliberate:
- A declared
safety.generator_mbpsalways wins. Somebody who knows the uplink is 100 Mbit/s is right, and this measurement is not evidence about their network. When the fallback is used, every line says so. - Plain
doctornever benchmarks. A report that quietly starts generating traffic is not a report. - It stays a warning, never a gate, like the estimate it feeds. A wrong number must not be able to stop a run somebody needs.
It needs k6 (exit 5 without it) and node, which serves the local endpoint: Python's http.server folds at a
few hundred req/s on loopback, so it would have reported the toy server's ceiling while calling it the
generator's.
discover¶
Fetches discover.sitemap from the profile, extracts <loc> entries, strips
discover.strip_prefix_regex (locale prefixes the site would redirect), de-duplicates, truncates to
--limit, and writes out/pool-<run>.json. Point a pool at it with "pages": "@pool-<run>.json".
With --verify it then requests each path and keeps only those answering 2xx, reporting what it dropped
and why:
▶ verifying 400 paths render (sequential, 0.05s apart — this is not a load test)
  ⚠️  383 of 400 render — 17 dropped (why, per path: out/pool-<run>.report.txt)
      status   404  /news/2019-archive
      redirect 301  /es/teams
Use it. A 404 is cheap for the app tier — or is itself rendered — and a 307 measures a redirect: a pool of either yields a flattering capacity number for a load that never reached the renderer. The alternative was "verify them by hand", which for 400 URLs means nobody does.
Verification is sequential with a pause between requests (CROWDSIM_VERIFY_DELAY, default 0.05s): building
a pool must not itself be a load test. It goes through the same allowlist gate as everything else, and the
report records when it was verified — regenerate after every deploy, since static-asset pools contain build
hashes.
If the document has no <loc> entries at all, discover exits 4 and says so, rather than writing an empty
pool that surfaces much later as "every class was dropped for want of a non-empty pool".
The same result is written as data, next to the pool, in out/discover-<run>.json: what the sitemap offered,
what survived the limit, whether verification ran, and every dropped path with its reason and status. It is
what the GUI reads, and it makes verified: false impossible to miss — an unverified pool is a pool nobody
has asked whether it renders.
probe¶
Preflight against one target: status, TTFB, page size, and every cache-relevant response header, saved to
out/probe-<run>.log — and, machine-readably, to out/probe-<run>.json. Run it before every load test.
Exits 4 for either shape of this target does not serve, and tells them apart in words, because they
send you to different places:
- it never answered — connectivity, not capacity: the address, the port, TLS or the network path;
- it answered ≥400 on the first pool entry — a load test against something that does not serve is not a capacity measurement.
Until 1.40.2 both of those exited 0. Everything that reads the status runs inside { … } | tee, which
is a subshell, so the variable the parent tested was always empty — the documented exit 4 was dead code
for as long as the log has been teed, and a scheduler reading it saw a preflight that passed.
The JSON is what makes load able to tell you the bandwidth a peak implies (below). Prose in a log is for
whoever reads this run; the number is for the run somebody starts next week.
It also states a verdict for every layer the profile declares in cache_headers, which is the part worth
reading twice:
── the layers this profile declares ──
  proxy  X-Proxy-Cache: HIT → HIT (matches /HIT|STALE|UPDATING/i)
  souin  Cache-Status: souin; fwd=miss → MISS (matches /hit/i)
  cdn    X-Cache: NOT PRESENT — nothing to classify
  ⚠️  1 declared header(s) never appeared. That is usually the wrong header NAME in the
     profile rather than a cold cache — and a layer that never speaks is reported as unknown,
     never as a miss, so it cannot quietly drag a hit ratio to zero.
Three answers, not two: hit, miss, and never spoke. The third is the one that matters, because a header
name that is wrong in the profile looks exactly like a cache that is not working — and reporting it as a miss
would put a confident 0% hit ratio next to a layer the request never crossed. Same rule as the load
generator's own classification (k6/lib/classify.js), so the two cannot disagree.
Only cache-relevant headers are stored in the JSON. A probe against a real site can come back with
Set-Cookie, and a run archive is not the place for somebody's session.
How much of a pool it checks¶
── how much of each pool answers (a sample, paced — not the whole pool) ──
  ✅ api    1 of 1 sampled (pool has 1) are served (1 of them 401/403: the route exists and wants a token)
  ✅ pages  2 of 2 sampled (pool has 2) are served
Until 1.33.0 probe requested pools.pages[0] and assumed the other 399. That is the trap this tool
documents everywhere else — 404s do not load the app tier, so a pool of invented paths yields a false
"it handles this beautifully" — surviving inside the one command whose job is to catch it before a run.
discover --verify does request every path it builds, but only for pools it built itself: a pool written
by hand, edited, or narrowed later never went through it.
--pool-sample <n> (default 5) is how many URLs per pool it checks. A sample, never the whole
pool, and spread across it rather than the first n — the first entries of a sitemap-derived pool are
the shallowest pages, which are also the most likely to exist. Paced by CROWDSIM_VERIFY_DELAY, the same
knob discovery uses: a preflight must not become the load test. Only pools a class actually draws from
are checked.
Nothing is sampled when the target did not answer the first request. That request already settled reachability; asking about every pool would send thirty more to learn the same thing — and against an address that drops packets each one costs the full budget. That is what made one probe take 2 minutes 7 seconds and turned a 90-second CI job into a 46-minute one (1.40.2).
A sample request is bounded and never retried: CROWDSIM_SAMPLE_MAX_TIME (default 3 seconds). It
answers does this path exist, and a path that did not answer inside the budget has answered that. The
first request keeps the longer timeout and the retry, because reachability is the one thing worth waiting
for.
A pool where more than half the sample is unserved exits 4: a class drawing from it would be ~100% failed, the brake would stop the run at a few req/s, and the numbers would describe a 404 handler. Below half it warns, and says the real share may be higher because this is a sample.
A 401 or 403 counts as served — the route exists and wants a token. Whether it should is the
premise check's question, below; counting it as a broken path reported a correctly configured authed
pool as mostly-404 and made probe refuse a healthy profile.
The premise of an authed class¶
If the profile has an authed class, probe sends a request per sampled path, without the token
(the same --pool-sample, since one endpoint answering 401 does not establish that the other 399 require
the token), and says what came back. A 401 or a 403 is the only thing that proves the class measures an authenticated read:
── the premise of every authed class (one request, sent without the token) ──
  ✅ authed_api  /api/me
     the endpoint refused the request without a token (401)
     so what this class measures is an authenticated read, not a public one.
  Every authed class is pointed at an endpoint that requires the token.
An endpoint that answers 200 without the header is refused, and probe exits 4:
  ⛔ whoami  /api/auth/whoami
     this endpoint does not require the token (200 without one)
     this class would send an anonymous GET wearing a bearer token, and report the result as an
     authenticated read. Point it at a path that answers 401 without a token, or drop the class:
     the numbers it produces describe the public path.
That is not a hypothetical. The first authenticated smoke against a real target used /api/auth/whoami,
which returns the same body with or without an Authorization header: the login was genuinely proven — a
real token, no token: 0 over 29 iterations — and the read was an anonymous GET reported as p50 63 ms of
authenticated traffic. The run was green and measured nothing, which is the exact failure this tool exists
to avoid. cs_denied cannot catch it: that counter is for a class being refused under load, and here
the anonymous request succeeds.
The other answers, and why they are not merged into two:
| Without the token | Verdict | probe |
|---|---|---|
| 401 / 403 | verified — the premise holds | continues |
| 2xx | the endpoint does not require the token | exits 4 |
| 404 / 410 | the pool names a path this target does not serve | exits 4 |
| 3xx | unknown: a redirect may be a login wall or a public canonical URL | warns, continues |
| 5xx, no answer | unknown: the check itself did not run | warns, continues |
A redirect is deliberately not counted as a refusal. From here a 302 to a login page and a 302 to a canonical URL that is then served publicly look identical, and picking one would be the confident wrong answer the rest of this is written against.
The half that needs no target is checked earlier, by validate and by load at startup: an authed
class that names no pool, or an empty one, is refused before anything runs. A class with no URLs sends
nothing — and a class that sends nothing is absent from every table in the summary rather than reported
as broken.
Without node the premise cannot be checked (the verdicts live in lib/premise.mjs). probe says so
rather than staying quiet, and does not present the class as usable.
load¶
The load test. Validates the profile, resolves the target, passes both gates, then runs k6 with one scenario
per class. Exits 0 whenever it executed — including when the brake tripped, because finding the knee is
the intended outcome. Writes out/summary-<run>.json, out/load-<run>.log, and appends to
out/history.tsv.
It also refuses to stay quiet about a generator that cannot win. A load run started from a container inside a VM — Docker Desktop on macOS or Windows, or WSL2 — says so before generating anything:
  ⚠️  THIS GENERATOR IS IN A CONTAINER INSIDE A VM (kernel 6.3.13-linuxkit).
      → run k6 natively on this machine, or put this container on a Linux host near the target.
Measured, repeatedly: the Docker network layer saturates before the target does, the iterations get dropped,
and the summary comes back generator_ok: false after the window is gone. It is a warning, not a gate:
the detection (a container marker plus a linuxkit/WSL kernel) misses runtimes that do not brand their
kernel, and refusing on a signal with false negatives buys nothing. The GUI in a container is unaffected —
it is a page, not a generator.
Before starting it states the bandwidth the requested peak implies, from the newest probe of that target:
  ℹ️  bandwidth: 380 req/s × 45 KB ≈ 17.6 MB/s (141 Mbit/s) sustained, from probe 20260805T120000Z
  ⚠️  THAT IS MORE THAN THE 100 Mbit/s THIS GENERATOR IS DECLARED TO SUSTAIN.
     Expect generator_ok: false. Move the generator closer to the target, or lower the peak —
     do not lower the SLO.
generator_ok: false is otherwise diagnosed after the window was agreed and the run burned, and most of
those runs were predictable beforehand. Declare safety.generator_mbps to have the comparison made; without
it the estimate is still printed. It is a warning and never a gate: the estimate assumes every request
weighs what that one page weighed, which is wrong in both directions, and a wrong estimate must never stop a
run somebody needs. The one thing it must not do is stay silent.
A server-side series, read against the run's own steps¶
crowdsim measures from outside: latency, failed rate, cache hit ratio, the knee. That is the right place to measure what users experience, and the wrong place to answer the question that follows immediately — why. A run ends with a defensible knee and cannot tell a saturated app tier from a CPU quota being throttled, and those have different fixes: one is a rewrite, the other is one line of configuration.
crowdsim load --profile p.json --peak 60 \
  --server-metrics throttle.csv --server-metrics-label cpu_throttled_periods
  ── cpu_throttled_periods, per step (handed to this run, not collected) ──
     step  requested  samples  mean      max
     s1            7        7         0        0
     s2            9        7      1.14        8
     s3           12        7        32       56
     peak         12        5        72       88
     This is a correlation and not a cause: the series moved during the same windows, which
     is a reason to look and not a finding on its own.
Alignment works because a run id is the run's start time in UTC and each step records its own offsets
from it, so any series recorded with a clock can be read against the step it belongs to. Written to
out/server-side-<run>.json, included in crowdsim report, and since 1.37.0 drawn by
report --html on the ramp's own step axis with p95 beside it — two scales, both named, because one
shared axis would make two different quantities look like one. A step with no samples is a gap: the
line breaks rather than spanning a window nobody recorded. The caveat is on the chart itself, since a
chart travels further than the paragraph next to it.
crowdsim does not go and get it. That is a decision, not a gap — the same one as the
access log: collecting would mean a load generator holding credentials for a metrics backend or a cluster,
which is a different tool with a different risk profile. --server-metrics takes a path; nothing in
lib/server-metrics-cli.mjs speaks HTTP, and a test asserts that.
And what comes out is a correlation, said as a correlation. A counter that rose during the same minutes is a reason to look, not a finding — promoting it to a cause would be the same mistake as quoting a knee as an absolute. A unit test asserts the caveat does not contain caused, because, explains or due to.
| Input | Accepted |
|---|---|
timestamp,value |
CSV, TSV or ;-separated. A header row is skipped rather than parsed as a sample. |
| JSON | [{"t": …, "v": …}] or [[t, v], …] |
| Timestamps | epoch seconds or milliseconds, decided by magnitude — never guessed, because guessing aligns a series to the wrong century |
Refusals, none of which fail a run that already happened:
- no label — an unnamed column of numbers cannot be read against anything;
- no overlap with the run's window — reported as such, rather than as a table of zeroes that reads like an idle server;
- a step with no samples is absent, not zero. Zero is a measurement; nobody recorded anything here is a different statement;
- a missing file, an unparseable one, or no node — the run stays archived and the series is simply not read.
Two follow-up runs the tool can start by itself¶
Both are off by default, and both refuse far more often than they agree. A tool that re-runs on its own generates load nobody typed a command for.
crowdsim load --profile p.json --peak 120 --start 40 --recalibrate   # first step died? try lower
crowdsim load --profile p.json --peak 120 --start 10 --certify       # knee swept? hold it
--recalibrate — when the ramp's first step does not survive, the run measured nothing: there is
no curve, and the tool already refuses to name a knee from it. Its entire output was a sentence telling
you to halve --start and run it again. Now it can do that, up to three attempts, halving each time and
keeping the ramp's shape (--peak comes down with --start, or the second step would be past capacity
instead of the first).
It refuses whenever the failure is not capacity: a generator-bound run, an unreachable target,
steps shorter than --abort-delay, a run that did complete a step, and — the interesting one —
a run whose failures are 404s:
  ── no follow-up run ──
     the failures in this run are 404s, not saturation: the pool names paths this target does not serve,
     so the same run at a lower rate produces the same result.
--recalibrate-floor <n> (default 1) is where it gives up. If the system cannot serve the floor, that is
the finding.
--certify — when the knee was swept through on the way up rather than held, certifying it is one
run at that rate with a --hold. --certify-hold <dur> sets how long (default 60s). It refuses a
refused knee — appending a hold there would produce a clean sustained number for a rate the run never
established — a knee that was already sustained, a run with a transient crossing (that is a cold cache:
use --warmup first), and a rate above the safe peak.
What makes this safe is the re-entry. A follow-up run is this same driver invoked again with two numbers changed, so:
- both gates are re-checked by construction, not inherited. The allowlist is matched again, and
--i-know-this-breaks-productiondoes not carry over: sweeping past the ceiling is a decision taken once on a command line, and holding that rate for minutes is a larger authorisation than passing through it. A sweep with the override followed by--certifygets the sweep and refuses the hold. - every attempt is its own run — its own run id, summary, log and
history.tsvrow. The attempt that failed is kept, because the fact that its--startwas too high is itself a capacity finding. - every other flag is forwarded verbatim. The follow-up filters the original command line rather than rebuilding one, so a flag this code did not think about is not silently dropped.
- one hold, not a chain: a certification does not certify itself.
Both need node (the decisions live in k6/lib/recalibrate.js and k6/lib/certify.js, where they are
unit tested). Without it the run is still archived and the follow-up is simply not attempted, with a line
saying so.
cache-ab¶
Brings up two nginx legs against the same origin, one as-is and one with your candidate config, so you can
load both with the same pool in the same window and get a hit ratio and offload factor you can defend.
Needs docker (exit 5 without it), so it does not work from inside the container image. See
cache-ab/README.md.
A third leg — normally the narrow subset of the fix you can actually ship this week, measured in the same window as the full change — needs no compose editing:
crowdsim cache-ab --new-leg narrow-fix.conf.template            # a copy of the candidate, renamed
crowdsim cache-ab --profile p.json --third narrow-fix.conf.template
It refuses (exit 2) a leg template that does not carry the candidate's warning about ignoring the origin's
Cache-Control — a third leg is a copy, and a copy is where that paragraph goes missing — and a leg still
identifying itself as candidate in X-AB-Leg, because two legs answering with the same name cannot be told
apart in the results. --new-leg satisfies both by construction and never overwrites an existing file.
--run goes the last step: it loads each leg with the same profile at the same peak, one at a time, and then
prints the delta between them.
Sequential on purpose — two generators at once on one host measure the host — so "same window" means the same
session, not the same second, and the output says so. The comparison is crowdsim compare, refusals
included. The legs live on 127.0.0.1, and --run does not grant itself that allowlist: it is checked
before a container starts, because a subcommand that can authorise a host on your behalf turns the gate into
a suggestion.
validate¶
Checks the profile against every rule at once and exits 2 if any of them is an error. Generates nothing.
It reports errors (the profile would fail, or produce a meaningless run) separately from warnings (it will run, but not necessarily mean what the author thinks):
▶ validating my-site.json
  ❌ classes[0].pool     unknown pool "nowhere"
  ❌ slo.brake_class     "gone" is not a class in this profile: nothing would abort the run
  ⚠️  pools.static        pool is empty: every class using it will be dropped from the mix
  2 errors · 1 warning — errors must be fixed before a run means anything
Everything at once, and errors first: a validator that stops at the first problem turns one fix into a sequence of round trips.
One implementation, two entry points. The rules live in lib/validate.mjs and the GUI's editor applies
exactly these, so validation cannot drift from what a run requires. load runs them before the safety
gates and refuses on errors; doctor --profile runs them and reports without failing.
Reaching them from bash means node, which the CLI otherwise does not need. Its absence is stated, not
hidden: validate exits 5 saying so, and load prints "full profile validation needs node — only the
structural checks ran" and carries on with what resolve_profile checks by itself (pool references,
missing pool files, empty pools). What it cannot catch that way is exactly the interesting half — a brake
class that does not exist, an allowlist of *, a read timeout below the p95 SLO.
weights¶
crowdsim weights /var/log/nginx/access.log --profile my-site.json
ssh edge 'zcat /var/log/nginx/access.log.*.gz' | crowdsim weights - --profile my-site.json
The class mix, counted on your own access log. This is the one input the tool insists must be measured —
every page here says the weights come from your edge log, and init writes them as a TODO for exactly
that reason — and until now nothing in the tool would read one, so the most important number in a profile
was left to somebody counting lines by hand.
A login or signup class is not counted here, and says so. They POST, this command counts GETs, so
no access log can ever produce a weight for them: they are reported as not countable here instead of as
0%, which are different findings with different fixes. Until 1.20.5 they were treated as plain classes,
and a login declared on a page pool matched every document GET in the log — a window with three page
views and one sign-in produced a mix of 100% login. An authed class is counted: it is a GET, and
whether your log can tell it apart from an anonymous one is yours to declare with log_match.
It does not go and fetch the log. That would mean privileged access to a production edge, which this project deliberately does not want: the log arrives as a file you hand over, or on stdin.
▶ 12 lines · 12 GET requests counted · 11 classified
     1 non-GET excluded: this tool sends GETs only

  class         kind      requests    share   weight
  rsc_page      rsc              6    54.5%     54.5
  html          plain            4    36.4%     36.4
  static        plain            1     9.1%      9.1

  unclassified                   1     8.3%          of the counted requests

  What nothing matched — the interesting part, because the mix above describes
  91.7% of the traffic and not all of it:
               1  /favicon.ico

  Decide which class each of those belongs to, then declare it — crowdsim will not guess:
     { "name": "…", "log_match": ["/*"], … }

  Paste into the profile (weights are relative; the generator renormalises them):
  "classes": [
    { "name": "rsc_page", "weight": 54.5, "kind": "rsc", … },
    { "name": "html", "weight": 36.4, … },
    { "name": "static", "weight": 9.1, … }
  ]

  ⚠️  This is your traffic between 2026-09-01T12:01:00 and 2026-09-01T12:22:00, by the log's own
      timestamps. A mix measured in a quiet hour does not reproduce a spike: the classes that
      grow under load are exactly the ones a quiet window under-weights.
  Nothing was written: no profile touched, no artefact in out/. An access log is not this
  tool's data to keep.
How a class is recognised. By what the profile declares, in this order — nothing is inferred from the shape of a URL:
kindis a hard filter, not a score. Anrscclass only ever matches a request carrying the navigation parameter (rsc.param, usually_rsc), and aplainclass only ever matches one without it. The same path is two different classes with and without it, which is the whole reason they are two classes.log_match— the path globs the class declares (see Profile reference).path_prefix— already declared, already unambiguous.- the class's own pool — the paths crowdsim would actually request for it.
First match in profile order wins, so a specific class declared before a broad one keeps its traffic.
A class that POSTs cannot be counted from a GET log, and says so. login and signup are writes, and
this command counts GETs only — the same reason a write is excluded from the mix. Those classes are listed
apart, with a dash rather than a zero, and the paste block asks for the rate you measured yourself (logins
per second, from your identity provider or your application logs). Reporting them as 0 would send
somebody looking for a login in a file that cannot contain one; and until 1.20.4 it was worse — a login
class declared before the document class, on the same pool, matched every document GET in the log and
took them from the class that had served them, so a log with three page views and one login produced a mix
of 100% login. An authed class is a GET and stays countable: whether your log can tell an authenticated
read from an anonymous one is what log_match is for.
What it will not do:
- Guess.
/favicon.icois obviously an asset and the command still refuses to file it understatic, because a guessed class is a made-up mix — the thing this command exists to replace. Give the class alog_matchand it is counted. - Hide the gap. Unclassified requests are a share of the counted requests, never folded into a class and never dropped. A mix computed from 40% of a log is a mix of something else, and past 10% unclassified the output says so in as many words.
- Compute a mix from a log it mostly could not read. Over half the lines unparsed is exit 2, with the
failing lines quoted as they were read and a pointer to
--format— not a confident mix built from whatever happened to fit. - Write anything. Not the profile, not an artefact in
out/, not a temp copy. An access log holds URLs, addresses and user agents;out/is a directory people copy from and a repository is one they commit from.
Excluded from the mix, and said so: non-GET requests (this tool sends GETs and nothing else, so a write
in the mix is a weight for load that will never be generated) and non-2xx/3xx (a 404 in the mix is a weight
for requesting URLs that do not exist — the same reasoning record applies to a browser recording).
A log that is not the combined format: describe its columns.
Known fields: request (a "GET /x HTTP/1.1" token), path, method, status, time, and - for a
column to skip. A field this command does not know is exit 2 rather than a column read by guesswork. With no
--format the request is found by shape — the token that reads like a request line — so a proxy that
logs an extra field in front still parses.
| Exit | Means |
|---|---|
| 0 | a mix was printed |
| 2 | usage, an unreadable profile, or a log this command could not parse |
| 4 | the log parsed and nothing in it matched a class: the profile does not describe this traffic |
Feeding it straight into a first profile: crowdsim init --access-log <file> drafts the profile and then
measures the weights through these same rules, in one step. See init.
init¶
crowdsim init --out my-site.json
crowdsim init --out my-site.json --access-log /var/log/nginx/access.log
Drafts a profile from the artefacts already in out/, and says which run each part came from:
  ✅ drafted my-site.json
     from probe 20260820T101500Z: target, page weight 46231 B, 2 declared cache layer(s)
     from discover 20260820T102000Z: pool pool-20260820T102000Z.json, 383 of 400 verified to render

  It will NOT run yet, by design:
     · safety.allow_hosts and safety.safe_peak_rps are empty — fill them in;
     · the class weights are a starting point, not your traffic mix — `crowdsim init
       --access-log <file>` measures them from your own log instead;
     · slo.max_p95_ms and slo.guillotine_ms are TODO, and the second must be your proxy's read
       timeout, or the 504s a run produces will be invisible to it.

  Then:  crowdsim validate my-site.json
Writing the first profile is the highest step in this tool, and most of it has already been measured by the
time somebody sits down to write it: probe knows the page weight and which cache layers answered,
discover --verify has a pool of URLs that render, record has a real fan-out. Those files were sitting in
out/ and nothing assembled them.
What it refuses to do is the point. It never fills in safety.allow_hosts — that would be crowdsim
authorising a host on your behalf — and never fills in safety.safe_peak_rps, which is a decision about how
far somebody's production may be bent. Both are left empty, the file says why, and validate refuses the
draft until a human fills them in:
▶ validating my-site.json
  ❌ safety.allow_hosts    declared and empty is not an allowlist: fill in the hosts this profile may
                           generate load against, or remove the key and pass CROWDSIM_ALLOW_TARGETS instead
  ❌ safety.safe_peak_rps  the safe ceiling has to be a positive number of req/s: the rate past which a run
                           needs --i-know-this-breaks-production on the command line
  ❌ slo.max_p95_ms        max_p95_ms has to be a positive number of milliseconds — this one is still the
                           TODO a drafted profile carries
  ❌ slo.guillotine_ms     guillotine_ms has to be a positive number of milliseconds — this one is still the
                           TODO a drafted profile carries
  ❌ name                  still a TODO from a drafted profile: this is a value only you can decide
  ❌ pools.assets[0]       still a TODO from a drafted profile: this is a value only you can decide
  6 errors · 0 warnings — errors must be fixed before a run means anything
Everything else it cannot measure is a TODO rather than a plausible value, for the same reason.
The class weights, measured. Hand over an access log and the draft's placeholder weights are replaced by
counted ones, through exactly the rules weights uses — one command instead of drafting, running
weights, and pasting:
  ✅ drafted my-site.json
     from probe 20260901T100000Z: target, page weight 46231 B, 0 declared cache layer(s)
     from discover 20260901T101000Z: pool out/pool-20260901T101000Z.json, 2 of 2 verified to render

▶ measuring the mix on /var/log/nginx/access.log
  ✅ mix measured: 11 of 12 GET requests classified, from 13 lines
     html             36.4
     rsc_page         54.5
     static            9.1
  ⚠️  8.3% unclassified: these weights describe 91.7% of the traffic, not all of it.
      See what did not match:  crowdsim weights <log> --profile my-site.json
     window: 2026-09-01T12:01:00 → 2026-09-01T12:22:00

  It will NOT run yet, by design:
     · safety.allow_hosts and safety.safe_peak_rps are empty — fill them in;
     · slo.max_p95_ms and slo.guillotine_ms are TODO, and the second must be your proxy's read
       timeout, or the 504s a run produces will be invisible to it.

  Then:  crowdsim validate my-site.json
The measurement travels into the profile, not only to the terminal: _classes_comment records how many
requests were classified, what share was not, and the window they came from, and _provenance gains a line
for the log. Each measured class says so in its own comment. What the log never showed keeps its placeholder
weight and gains a TODO: NOT ONCE in the log that was measured — a class is not deleted because one window
did not contain it, which is how a mix loses its long tail.
Nothing from the log reaches out/ on this path either: the draft receives counts, shares and the window,
never a URL. If the log cannot be parsed, the draft is kept with its placeholder weights (it is right;
only the mix is still a guess) and the command exits with the parser's own code.
- With no
probeand nodiscoverartefact it exits 4 and names the two commands to run first, instead of writing a hollow file. - It never overwrites an existing file (exit 2), and refuses to write into the profile directory (exit 2) — that is the one that gets committed, and a profile names real routes on a real host.
- An unverified pool is carried across with the warning attached, in the file.
compare --html draws the delta as a delta — the bar is the change, centred on zero, left better
and right worse. Two absolute bars would leave the reader subtracting by eye, and the delta is the one
number this tool is confident about: the absolutes come from a synthetic pool of cold URLs and travel
badly.
It is drawn from what --json prints, which is why it is allowed to exist at all. report --html refuses
to draw two runs, rightly — two runs on one pair of axes without compare's refusals is a picture of two
different experiments — and this page has those refusals because it has no second opinion: a refusal
stops the drawing, and adding one to compare cannot leave the picture behind.
report¶
crowdsim report 20260820T125256Z                      # → out/report-<run-id>.md
crowdsim report 20260820T125256Z --compare 20260819T171100Z
crowdsim report 20260820T125256Z --out ticket.md
crowdsim report 20260820T125256Z --html               # → out/report-<run-id>.html, with charts
One run as markdown, written for the place the result actually goes: a ticket, a PR, an incident timeline. The caveats travel with the numbers, because the caveats are what does not survive retyping — somebody pastes a p95 into a channel and it becomes a capacity figure by Tuesday.
The order is the order in which a run has to be read: is it valid, what happened, then the numbers.
## Is this run valid?

Yes. The generator held the requested rate (0 dropped iterations of 11 requests), and the target answered.

## What happened

The brake aborted the run: **you found the knee**, which is what this tool is for. It is not a failure of
the run or of the tool.

Stopped by class **rsc_page** — `p(95)<300`, reached 465.

**Past the 1000 ms read timeout:** 0.00% of requests. That share, not the average latency, is the margin you
actually have — past it a real visitor gets a 504.
It leads with the knee — the highest rate the run measured the system surviving and the rate at which it stopped — because that is the sentence the document is being written around. A run that cannot support a knee gets the refusal instead, with what to change: an omitted section would read as no knee found, and then the requested peak gets quoted.
A run with generator_ok: false produces a report that says DISCARD THIS RUN and prints no latency
table at all: there is nothing in it to quote. A layer whose header never appeared is reported as n/a — the
declared header never appeared in any response, never as 0%. --compare delegates to
compare, refusal included: if the two runs are not comparable the report says so instead of
carrying a percentage.
The report describes your infrastructure — it names your hosts. It says so in its own footer, and out/ is
gitignored for the same reason.
--html: the same run, drawn¶
crowdsim report 20260820T125256Z --html                 # → out/report-<run-id>.html
crowdsim report 20260820T125256Z --html --out incident.html
A ramp is a curve, and a table of eight rows asks the reader to draw it in their head. The GUI has plotted it since 1.17.0 — and only the GUI, so the moment a result left the page it went back to being a table. This is the same run as one self-contained page: the ramp with the SLO and the read timeout on it, the knee as a band between the last clean rate and the first crossed one, p95 per class against the limit each class is actually held to, and the cache per layer.
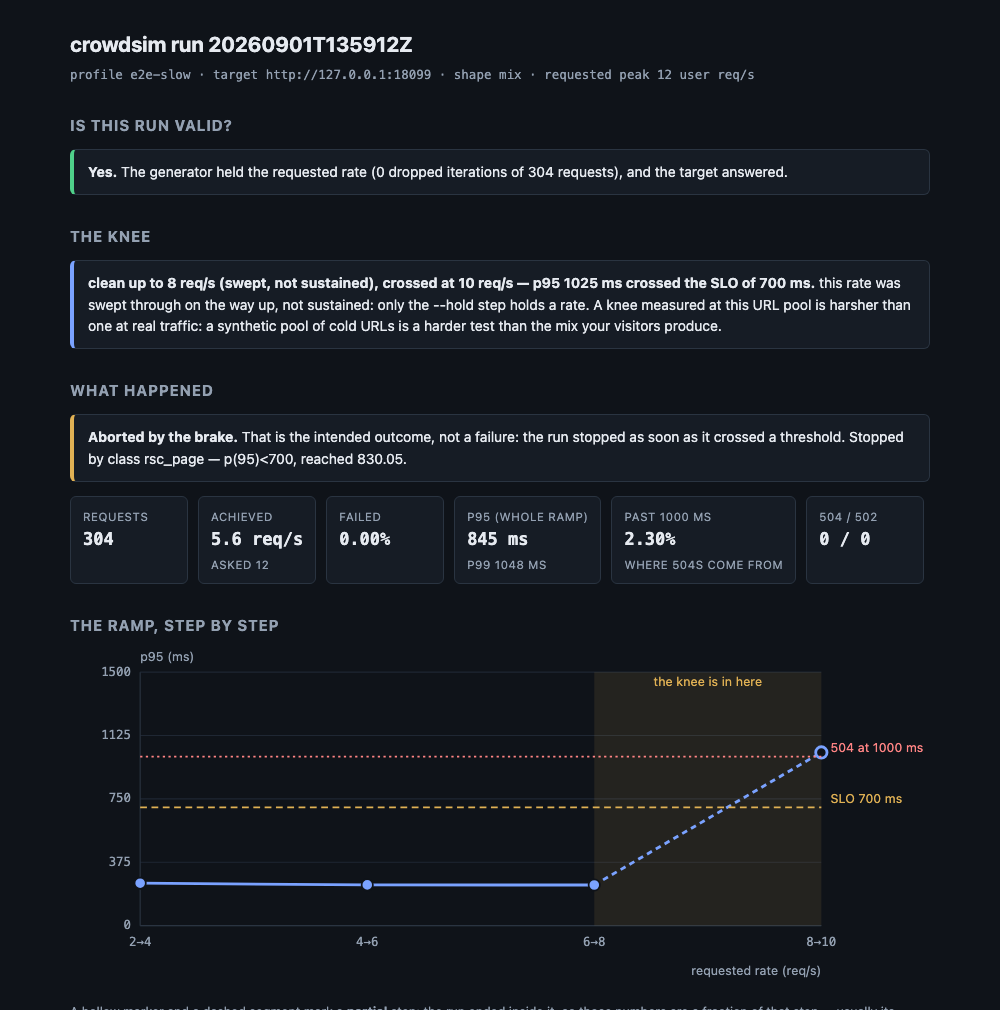
One file, no dependencies: no script, no font, no stylesheet, nothing fetched. It opens offline, attaches to a
ticket, and prints to PDF (⌘P) with the tables expanded. Needs node — the chart geometry lives in
lib/report-html.mjs, where it is tested; the markdown report needs nothing but python3, and is unchanged.
What the charts refuse to draw. A chart is the most persuasive thing this tool can produce, so each of these is a rule with a test behind it:
- An invalid run gets no latency chart at all.
generator_ok: falsemeans no step measured the rate it claims, and a curve drawn from it looks exactly like a healthy system absorbing load. What such a run does get is the one chart that shows why it is invalid — requested rate against delivered rate. Same for a target that never answered: a p95 of nearly zero is not a fast system. - A knee recorded next to a verdict that voids it is shown as not counting.
crowdsimrefuses a knee on an invalid run, but an older summary can carry both; the verdict wins, and the page says so rather than drawing the band. - A threshold line is drawn only when the run recorded the threshold.
summary.sloexists from 1.19.0; a run archived before that gets a curve with no limit line, and a sentence saying why. A line at a guessed limit moves the knee for the reader. - A threshold that does not fit the scale is named, not silently dropped. A read timeout ten times the p95 would flatten the curve into the bottom of the picture, so it is left off — and said to be left off, because a line that is simply absent reads as a limit nothing came near.
- A partial step is drawn as a partial step: hollow marker, dashed segment, and a note. The brake fires while latency is climbing, so the step it fired in is a fraction of one, biased towards its worst part.
unknownis not a miss and not 0%. A cache layer whose header never appeared has no hit ratio at all; a zero bar would read as a cache that answered and missed every time — usually a wrong header name in the profile, which is a different bug with a different fix.
Every chart carries the same numbers as a table underneath it (open in print, collapsed on screen) and describes itself in words for a screen reader — a chart nobody can quote from is a chart somebody retypes by eye.
--html reports one run. --html --compare is a usage error: a delta between two runs is
compare, and drawing two runs on one pair of axes without its refusals would put a confident
picture behind two different experiments. The markdown report embeds the comparison, refusals included.
history¶
out/history.tsv as a table: one line per run. What it is for is watching whether the knee moves after a
change — not for reading a single run, which is what the summary is for.
The default view is eight columns, not fourteen, and always keeps the run id and the knee. A run whose generator did not hold the rate is marked in the margin:
   run_id            profile  shape  peak  rps   p95   failed  knee_clean  knee_crossed
⛔ 20260901T121500Z  site-a   mix    80    20.0  300   0.002
   20260901T111500Z  site-b   mix    60    55.1  5100  0.06    40          50
   20260901T101500Z  site-a   mix    40    39.8  210   0.001   30          40
A discard carried in a column at the far right is a discard nobody reads, and a discard that reads like a result is worse than no row at all.
| Flag | What it does |
|---|---|
--last <n> |
the n newest runs |
--target <host> |
only runs whose base_url host contains this |
--profile <name> |
only runs of this profile |
--cols a,b,c |
exactly these columns, named as they are in history.tsv. run_id is never dropped |
The default view renders each knee as one requested→delivered cell; --cols and --json give the four columns separately. |
|
--json |
the same records the GUI's history endpoint returns |
A filtered or truncated view says so, on its last line, with the total — showing 2 of 3 runs · --last
2. A subset of runs that looks like all of them is the same class of mistake as a p95 quoted for a rate
that never happened.
--html draws the question this subcommand exists for. One line per experiment: runs at a
different profile, target, shape or fan-out are separated rather than averaged, because they are not
points on one line. The fan-out rule is comparableFanOut from k6/lib/delivery.js, not a second copy. A
discard (generator_ok: false) never joins a line and is listed under Left out, and why, with the run
id. A run whose knee was refused is a gap in the line, not a zero — a knee of 0 req/s would be a claim
about the system. And one run is not a trend: the page says so rather than drawing a line through a single
point, which is the same refusal that stops a knee being read off one step.
The records go through the same --json view the table is built from, so the page and the terminal cannot
disagree about what a run was. --out <file> says where it goes (default out/trend-<run>.html).
The parser stays header-keyed, so rows written before a column existed keep working and a missing cell
prints empty rather than 0. The knee columns (knee_clean, knee_crossed) are empty rather than 0
whenever a run could not support one — see the knee. A
knee of 0 req/s is a claim about the system; this run predates the knee is not the same statement.
--json emits the same record shape gui/server/lib/history.js produces, and
tests/gui/history-shape.test.js runs both against one fixture and compares them field by field. Two
shapes would mean the page and the terminal disagreeing about what a run was, while somebody is deciding
something.
Aligned in python3, not with column(1): that comes from util-linux, busybox does not have it, and this
subcommand used to exit 127 inside the published image.
next¶
Where you are. What out/ already holds from probe, discover and a completed run; which profiles
exist and which of them are still drafts; and the one command to run next, as text to copy.
▶ where you are

  Measured so far (/work/out)
    ·  probe     nothing yet — reachability, page weight, cache layers
    ·  discover  nothing yet — a pool of URLs that actually render
    ·  summary   nothing yet — a completed load run

  Profiles (/work/profiles)
    ⚠️  profiles/site.json  draft: safety.allow_hosts, safety.safe_peak_rps

  Next
    profiles/site.json is a draft, and the two things it is missing are not things this tool
    gets to decide:

      safety.allow_hosts    which hosts this tool may generate load against. There is no
                            default anywhere — without it every run exits 3.
      safety.safe_peak_rps  the rate above which a run needs
                            --i-know-this-breaks-production on the command line, every time.

    Edit profiles/site.json, then:

      crowdsim validate profiles/site.json

  This command generated no traffic, wrote nothing and changed no profile.
Getting from a clean checkout to a run is doctor → discover → probe → init → editing the TODOs
and the two deliberately empty safety keys → validate → load. Every one of those is documented and
every one works; what was missing was any answer to where am I. doctor reports on the machine and
stops, init writes a draft and stops, and the only thing that knew a profile was still a draft was
validate — which you had to run to find out.
It fills nothing in. safety.allow_hosts and safety.safe_peak_rps are the two gates, and the next
step this command names for them is you decide these — never a suggested value. There is no wizard, no
prompt and no -y: a guided setup is exactly where an interactive confirmation would get added by
accident, and this tool has none on purpose (see Safety).
It generates no traffic, writes nothing, and never edits a profile — which is what makes it safe to run blind, on a machine you have just walked up to.
serve¶
Starts the GUI (needs node and a built UI). Binds 127.0.0.1:8787 by default and refuses any other bind
address without CROWDSIM_GUI_TOKEN. See GUI.
Flags¶
Only load uses most of them. A flag the subcommand does not take is an error (exit 2), and so is a
flag the tool does not know at all — neither is ever ignored:
❌ --out is not a flag of `probe`. These subcommands take it:
     report, init, record
  It was accepted and then ignored before, which is worse: you asked for something and did not get it.
  See: crowdsim probe --help
Until 1.28.0 the argument parser was one flat case over every flag the tool understands, so every flag
was accepted by every subcommand and then ignored by most of them. crowdsim probe --profile p.json --out
/tmp/elsewhere exited 0 and wrote its output to $CROWDSIM_OUT: a directory was asked for and a
different one was used, silently. That is the same class of mistake as an unknown flag, and it is now the
same refusal.
The accepted set per subcommand comes from the same #@ <name> help blocks that crowdsim <sub>
--help and the completions read — specifically the lines that
declare a flag, not the prose that mentions one. So a flag cannot be accepted without being documented,
and cannot be documented without being accepted; tests/cli/flags.bats holds both directions, and asserts
that every argv the GUI builds stays inside them.
| Flag | Default | Applies to | What it does |
|---|---|---|---|
--profile <file> |
— | all but doctor/history/serve |
The profile. Required. |
--target <name> |
targets.default |
load, probe, discover, cache-ab | A named target from the profile. |
--base-url <url> |
— | load | Bypasses target resolution entirely. Still subject to the allowlist. |
--shape mix\|journey |
mix |
load | mix = one scenario per class; journey = visitor sessions from a recorded journey file. |
--peak <n> |
60 |
load, cache-ab | Total user requests/s at peak, split across classes by weight. |
--start <n> |
15 |
load | Rate of the first step. |
--steps <n> |
4 |
load | Number of linear steps from start to peak. |
--step-dur <dur> |
60s |
load | Duration of each step. |
--hold <dur> |
120s |
load | Time held at peak. 0s means climb and leave. |
--rsc-mode repeat\|random |
repeat |
load | repeat replays the few distinct navigation URLs a real build produces; random measures the opposite hypothesis (a genuine cache-buster). |
--max-p95 <ms> |
slo.max_p95_ms |
load | Brake: abort when the brake class's p95 crosses this. |
--max-5xx <ratio> |
slo.max_failed_rate |
load | Brake: abort when the failed rate crosses this. |
--abort-delay <dur> |
30s |
load | Grace period before the brake is evaluated, so a cold start does not abort the run. |
--safe-peak <n> |
safety.safe_peak_rps |
load | The ceiling for this run. Can only make the gate stricter in practice — going above still needs the override. |
--i-know-this-breaks-production |
off | load | The only way past the safe peak. Command line only, every time. |
--warmup <dur> |
off | load | A separate, unmeasured run before the measured one: fills the caches, opens the pools, JITs the app. Its numbers are written to warmup-<run>.json and are not mixed into the result. |
--warmup-peak <n> |
--start |
load | Rate for the warm-up. Subject to the same safe-peak gate as anything else. |
--touch-and-go |
off | load | Preset: --steps 3 --step-dur 20s --hold 0s --abort-delay 10s. The cheapest ramp that still produces errors — not a way to make a test harmless. |
--skip-classes <a,b> |
target's skip_classes |
load | Classes to leave out (routes a given tier does not serve). |
--insecure |
target's insecure |
load, probe | Skip TLS verification, for a node addressed by IP. |
--slack |
off | load | Post a recap to CROWDSIM_SLACK_WEBHOOK. |
--dry-run |
off | load | Print the exact k6 invocation and stop. Sends nothing. |
--limit <n> |
400 |
discover | Maximum URLs in the pool. |
--verify |
off | discover | Request each discovered path and keep only those answering 2xx. Sequential, paced by CROWDSIM_VERIFY_DELAY. |
--ttl <s> |
10 |
cache-ab | Cache TTL for the candidate leg. |
--port <n> |
8787 |
serve | GUI port. |
--bind <addr> |
127.0.0.1 |
serve | GUI bind address. Anything but loopback needs a token. |
--format <fields> |
combined | weights | Column names of a log that is not the combined format: request, path, method, status, time, -. |
--top <n> |
10 |
weights | How many unclassified paths to show. |
--access-log <file> |
— | init | Measure the class weights from this log instead of drafting them as a TODO. |
--json |
off | compare, weights | Machine-readable output. For weights it carries counts, shares and the window — never a path from the log. |
--html |
off | report | The run as a self-contained page with charts instead of markdown. Needs node. |
--out <file> |
— | record, report, init | Where to write the journey file, the report, or the drafted profile. |
-h, --help |
— | all | The usage header. |
-V, --version |
— | — | The version, including inside the image where nothing else can say. |
Environment¶
| Variable | Default | What it does |
|---|---|---|
CROWDSIM_ALLOW_TARGETS |
none | Comma-separated host globs the tool may hit. Required unless the profile declares safety.allow_hosts. No default, by design. |
CROWDSIM_OUT |
./out |
Where summaries, logs, resolved profiles and history.tsv go. |
CROWDSIM_PROFILES |
./profiles |
The directory the GUI reads and writes. |
CROWDSIM_SLACK_WEBHOOK |
unset | Target for --slack. A secret: never hardcode it. |
CROWDSIM_ROOT |
parent of the script | Where k6/, gui/ and cache-ab/ live. Set to /crowdsim in the image. |
CROWDSIM_K6_SCRIPT |
$CROWDSIM_ROOT/k6/live-event.js |
The generator script. |
CROWDSIM_GUI_PORT / _BIND / _TOKEN |
8787 / 127.0.0.1 / unset |
See GUI. |
CROWDSIM_BIN |
see GUI §the driver | Which driver the GUI spawns. Set explicitly in the image. |
CROWDSIM_VERIFY_DELAY |
0.05 |
Seconds between requests during discover --verify. Building a pool must not be a load test. |
CROWDSIM_SAMPLE_MAX_TIME |
3 |
Seconds a single probe pool/premise sample may take. Not retried: a path that did not answer in time has answered. The preflight's own first request is not bounded by this. |
Exit codes¶
They are an API: the Nomad job, CI and the GUI all branch on them.
| Code | Meaning | Typical cause |
|---|---|---|
0 |
Executed | Also when the brake tripped — that is an outcome, not an error |
2 |
Usage | Unknown flag or subcommand, missing/unparseable profile, unknown target, --shape journey without journey.file · since 1.28.0 also a flag that belongs to a different subcommand |
3 |
A safety gate refused it | No allowlist, host not allowlisted, peak above the ceiling without the override, GUI asked to bind off-loopback without a token |
4 |
Nothing usable came out of it | probe got ≥400 or no answer (both shapes, and both actually exit 4 since 1.40.2), or found an authed class whose endpoint does not require the token (1.24.0) — a class that would measure the public path; record found no page in the HAR; weights classified nothing in the log; init found no artefacts to assemble — and, since 1.20.4, a load whose generator produced no summary: a run that never happened is not a success, and until then it warned on a terminal and exited 0 |
5 |
Missing or broken prerequisite | k6 absent, docker absent for cache-ab, node absent for serve, validate, record or weights — and, since 1.20.2, a profile validator that crashes instead of reaching a verdict: that is the installation, not the profile, and it used to be reported as exit 2 |
compare¶
The delta between two runs from out/: overall p50/p95/p99, failed rate, the share past the read timeout,
504s, the cache hit ratio per layer, and the same per class. An improvement and a regression are marked
differently, and the footer says what the numbers are worth:
  A  20260805T090000Z   profile live-event  https://www.example.test  shape mix  peak 60
  B  20260805T093000Z   profile live-event  https://www.example.test  shape mix  peak 60

  ── overall ─────────────────────────────────────────────────────────────────────
                               A           B   change
  p95                     200 ms      140 ms   -60 ms (-30%) ✅
  failed rate              0.00%       0.00%   +0.00 pp  =

  ── cache hit ratio per layer ───────────────────────────────────────────────────
  proxy                   61.00%      94.00%   +33.00 pp (+54%) ✅
  cdn                        n/a         n/a   header never appeared in either run
The value is in what it refuses (exit 2), because a comparison between two runs that were not the same experiment is a confident number with nothing behind it:
| It refuses when | Because |
|---|---|
either run has generator_ok: false |
that run has no numbers at all — the generator was the bottleneck |
| either run never reached its target | connectivity, not capacity |
| the URL pools differ | two different experiments; a colder pool is a harder test. Compared from the archived profile-<run>.json, which is why it is archived |
| a pool exists in only one run | same reason |
| the shapes differ | a journey and a mix are not the same load |
A different target or a different peak is a legitimate question — what does the CDN add, where is the knee — so those are allowed and stated: the report says this is a comparison between two targets, not a before/after of one.
--json prints the same thing as data — the same verdicts, the same refusals, the same exit code — which is
how the GUI shows a comparison without owning a second copy of these rules:
record¶
crowdsim record session.har                        # → out/journey-<run>.json
crowdsim record session.har --out ~/private/journey.json --force
Turns a browser HAR export into the journey file --shape journey needs. In DevTools: Network → Preserve
log on → reload the page → click around → the ⬇ Export HAR button. Then:
  ✅ 2 pages · 1 navigation requests · 4 assets
     origin https://www.example.test  →  out/journey-20260805T174432Z.json
     from 12 recorded requests
     dropped 2 third-party (fonts.gstatic.com, www.google-analytics.com) — not your capacity problem,
             and not yours to generate load against
     dropped 1 that did not answer 2xx/3xx
     dropped 1 non-GET (this tool does not send writes)
     stripped per-request query params: _, _rsc
Four judgements it makes, all of them ways to end up measuring something other than your site:
- Third-party hosts are dropped. Analytics and fonts are not your capacity problem, and generating them would aim load at somebody else's infrastructure — from a tool whose premise is that you only hit hosts you explicitly allowed.
- Per-request cache-busters are stripped; per-build ones are kept. Measured, not guessed from a list of names: if a parameter's value varies between requests to the same path it is noise, and keeping it turns the recording into a pool of unique cold URLs — the pool that makes any cache look useless. A constant value is a build hash, part of the URL the cache sees, and dropping it would measure a URL that does not exist.
- The navigation parameter (
_rsc) is stripped entirely, because the generator adds it back itself, and whether it repeats or is randomised is the experiment (rsc.mode). - Failures and non-GET requests are not recorded. A 404 in a journey is a load test of your error page, and this tool does not send writes at a production system.
The origin travels inside the file: a journey recorded against staging tells you nothing about production's
fan-out. record refuses to write into the profile directory — a journey names real routes, the same
category as a URL pool — and refuses to overwrite an existing file without --force. Needs node; the rules
live in lib/har.mjs with unit tests. Exit 4 when nothing usable was recorded, with what to record instead.
Re-record after a redesign or a deploy that changes the fan-out: a journey is a snapshot of what one build made the browser fetch.
Output files¶
out/
  summary-<run_id>.json    the result — see Reading results
  load-<run_id>.log        the full run log
  probe-<run_id>.log       the preflight
  probe-<run_id>.json      the same as data: page weight + a verdict per declared cache layer
  pool-<run_id>.json       what discover found
  pool-<run_id>.report.txt what --verify dropped, and why
  discover-<run_id>.json   the same as data: offered, kept, dropped, and whether it was verified
  journey-<run_id>.json    what record extracted from a HAR (data about your site: keep it private)
  warmup-<run_id>.json     the warm-up's own summary, kept apart so it can never be read as the result
  warmup-<run_id>.log      the warm-up's log
  report-<run_id>.md       what `report` wrote: the run with its caveats attached
  profile-draft.json       what `init` drafted, if you did not pass --out
  profile-<run_id>.json    the profile as resolved for that run (pools inlined)
  history.tsv              one appended line per run
  bench-<run_id>.json      what doctor --bench measured this machine doing, and where it was measured
                           (loopback: a ceiling — and not one at all if taken inside a VM)
  gui-run.json             written by `serve` only: the run in flight, so a restart can find it
<run_id> is a UTC timestamp, 20260805T093710Z. Every subcommand that writes files announces its run id in
its output, which is how anything reading afterwards — you, or the GUI — finds them. out/ is gitignored: it
names your hosts.
See also¶
- Running a test — how these commands fit together
- Profile reference — what
--target, the classes and the SLO come from - Reading results — the summary, field by field